
Your agency’s client churn rate is the percentage of clients, or client revenue, you lose over a set period. To calculate it, divide the clients lost in a month or quarter by the clients you started that period with. Then track three numbers, not one: logo churn (clients lost), gross revenue churn (dollars lost), and net revenue retention (dollars kept after upsells). Net revenue retention is the one that predicts whether you grow without constantly selling. Most owners can quote their close rate to the decimal and have no idea what their churn is. That gap is expensive, and it is fixable in an afternoon.
You have probably seen the line that “agencies lose about a third of their clients a year.” I went looking for the source behind that stat, and the one about a sub-five-year client lifespan, and could not verify either. Neither can you. So stop quoting a number you cannot stand behind in a renewal meeting and start measuring your own. Here is the calculator and the math to do it.
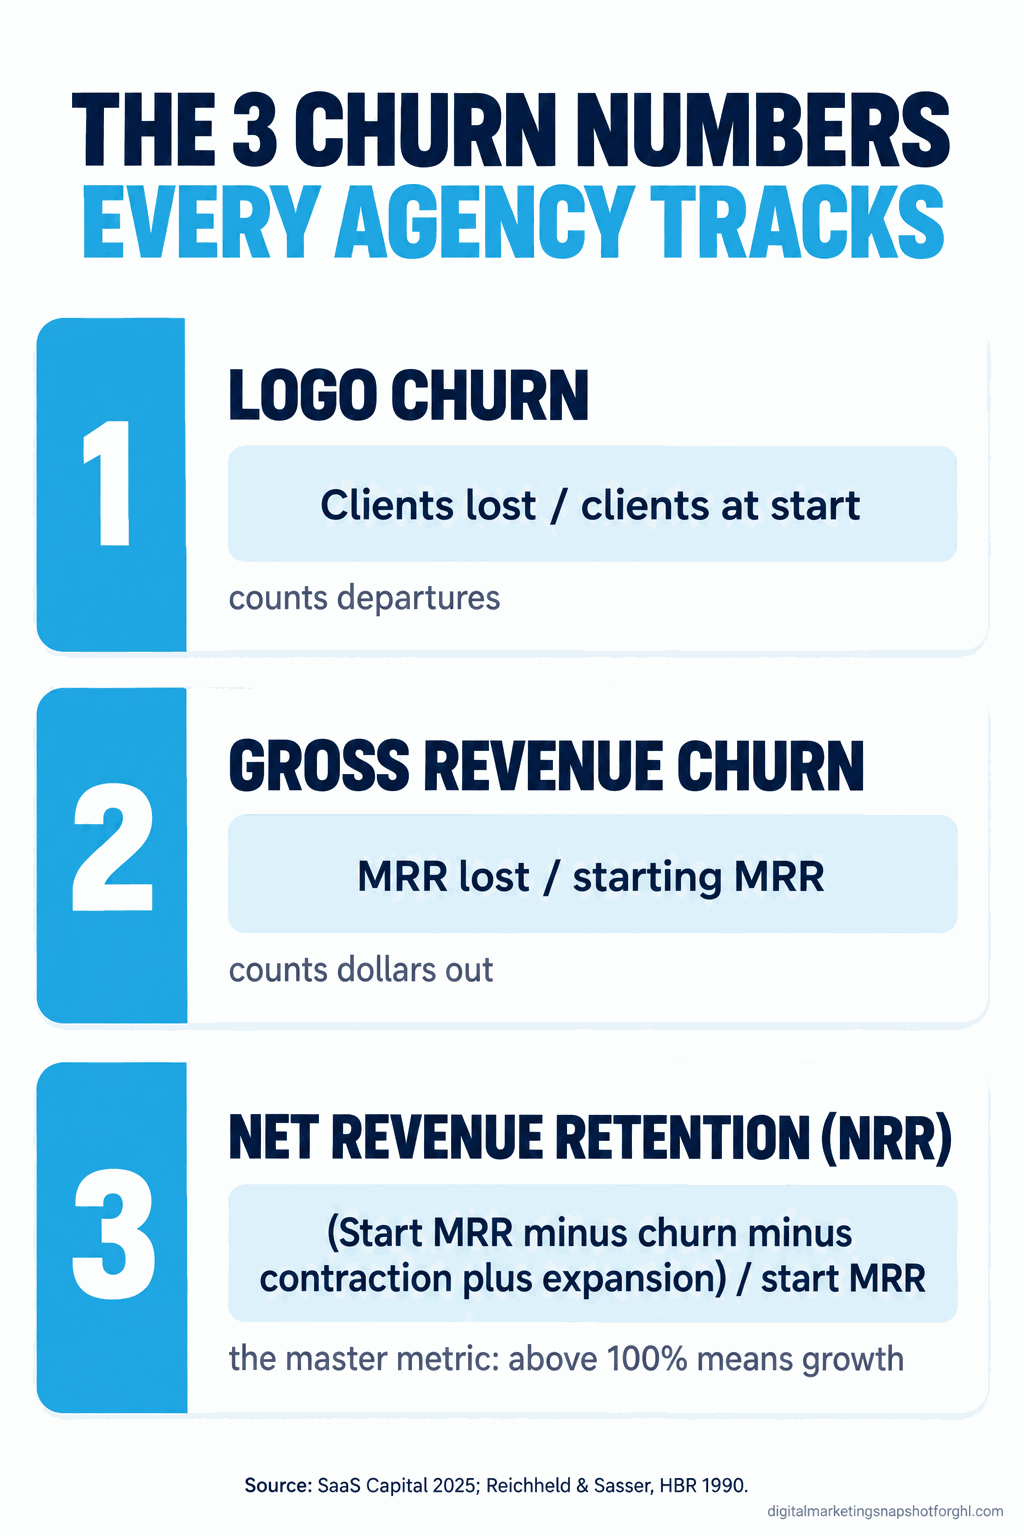
Table of contents
- Why you can’t name your own churn rate
- What churn actually costs you
- The three churn numbers every agency should track
- How to calculate each one (with worked examples)
- The steal-this churn calculator
- Where your churn number lies to you
- The same calculator at three agency sizes
- Objections agency owners actually raise
- FAQ
Why you can’t name your own churn rate
It is the first Monday of the quarter and you just signed a new client at $3,000 a month. Good feeling. You tell the team, update the pipeline, move on. What does not get said out loud is that two clients quietly offboarded in the last ninety days, one a $4,500 retainer. On paper you added a logo. In the bank you went backwards, and nobody ran that math because nobody owns it.
That is the normal state of a small agency. Acquisition gets a dashboard; retention gets a feeling. You can quote your cost per lead but not what share of revenue walked out the door last year, and you cannot fix a number you have never calculated.
Owners avoid it because the number can sting, and the folklore gives them cover. If “everyone churns about a third a year,” your losses feel normal. But that cover stat does not survive contact with a source: the repeated agency figures, a one-third annual loss and a sub-five-year client lifespan, trace back to nobody in particular. Even the famous retention research needs a careful read, since the 1990 claim that cutting defections 5% lifts profit 25% to 95% was, by the authors’ own description, a modeled thought experiment, not a measured result (Ipsos). The principle holds; the precise multiplier does not travel to your agency.
The reframe: industry averages are trivia, your churn rate is strategy. The rest of this piece gets yours in writing.
What churn actually costs you
Churn is three costs stacked together, which is why it is easy to underprice.
The replacement cost. Winning a client is the expensive way to fill a seat. The widely cited range, from late-1980s service-quality research popularized by Bain, puts acquiring a customer at five to twenty-five times the cost of keeping one (Harvard Business Review). Treat it as directional, but you know the shape: pitches and proposals cost real hours, and a replacement starts at zero trust.
The utilization cost. Every churned client you replace means re-onboarding, which burns hours the client does not pay for. Billable utilization across professional services fell to a historic low of 66.4% in 2025, under the 70% most firms consider healthy, while high performers held 75.0% (SPI Research 2026 Benchmark, 509 firms). Churn is one quiet reason that number sags, as our guide to billable utilization for agencies explains.
Billable utilization, 2025. Source: SPI Research 2026 Professional Services Maturity Benchmark (509 firms).
The compounding cost. This is the one that hides. A 5% monthly client loss does not mean 5% a year, it compounds. Picture a $20,000 monthly book where you sign nothing new and lose 5% of revenue a month. By month twelve you are down to about $10,800, almost half, with no single dramatic event to point at. The chart below models that decay: not survey data, but exactly the arithmetic of a leaky book.
Monthly recurring revenue retained from a $20,000 book at 5% monthly client churn, no new sales. Illustrative model, compounded monthly.
Stack those three and a “small” churn problem is usually the biggest line item nobody manages. It is why agency margin shrinks as you grow when churn is ignored: you pour new revenue into a bucket with a hole in it.
The three churn numbers every agency should track
A single churn percentage is nearly useless alone, because a $500 client and a $5,000 client count the same by logo. You need three numbers, each answering its own question.
| Metric | What it answers | Formula (per month or quarter) | What it misses alone |
|---|---|---|---|
| Logo churn | How many clients are we losing? | Clients lost / clients at start | Deal size. Ignores whether you lost whales or minnows. |
| Gross revenue churn | How many dollars are walking out? | MRR lost / MRR at start | Expansion. Hides that upsells may cover losses. |
| Net revenue retention (NRR) | Is our existing book growing on its own? | (Start MRR minus churn minus contraction plus expansion) / start MRR | Nothing important. The one to steer by. |
Logo churn is your early-warning light, gross revenue churn the dollar damage, NRR the verdict. Above 100% NRR, your current clients spend more over time than the leavers take, so the book grows in a month you sign nobody. Below 100%, you sell just to stand still. Across private B2B subscription businesses the median NRR was about 101% in 2025, gross revenue retention near 90% (SaaS Capital). Agencies are not SaaS, but a retainer book is a subscription book: every downgrade is contraction, every upsell expansion, every offboard churn.
How to calculate each one (with worked examples)
Grab last quarter’s numbers: clients at the start, clients lost, starting monthly recurring revenue (the sum of all retainers), and revenue added or lost from existing clients. Here is each calculation with a worked example and its trap.
Logo churn rate
Count the clients you had on day one and the ones who fully left during the period. Do not count new signings in the denominator.
Logo churn % = (clients lost / clients at start) x 100

Example: started with 20 clients, 2 offboarded.
= (2 / 20) x 100 = 10% logo churn
The failure mode: logo churn treats every client as equal weight. Lose two $800 clients and it looks identical to losing one $800 and one $6,000. Use it as a tripwire, never the headline: when it ticks up, go straight to the revenue numbers.
Gross revenue churn rate
Now weight it by money. Add up the recurring revenue lost from clients who left or downgraded, and divide by the MRR you started with.
Gross revenue churn % = (MRR lost / MRR at start) x 100

Example: started with $60,000 MRR. Lost a $4,500 client and a $1,500 downgrade.
= (6,000 / 60,000) x 100 = 10% gross revenue churn
The failure mode: gross revenue churn ignores your upsells. An agency can post 10% gross churn and still grow if expansion outpaced it. Report it to see the raw leak, but never make a retention decision on it without the next number.
Net revenue retention
This is the one to put on the wall. Start with opening MRR, subtract what churned and contracted (downgrades), add what expanded (upsells), then divide by opening MRR.
NRR % = ((start MRR - churned MRR - contraction + expansion) / start MRR) x 100

Example: start $60,000. Churn $4,500. Contraction $1,500. Expansion $9,000.
= ((60,000 - 4,500 - 1,500 + 9,000) / 60,000) x 100
= (63,000 / 60,000) x 100 = 105% NRR
You lost 10% of revenue to churn and contraction and still grew the book 5%, because expansion covered it: a healthy agency even in a slow sales month. Flip expansion to $3,000 and NRR drops to 95%, and the book is shrinking whether you feel it or not. NRR is also what makes reporting clients actually read pay for itself, since reporting drives the renewals and upsells that push it past 100%.
The steal-this churn calculator
Build it in a spreadsheet in about ten minutes: a tab called “Churn,” one row per month, with these columns.
| Column | What goes in it |
|---|---|
| A. Month | One row per month |
| B. Clients at start | Carry over from last month |
| C. Clients lost | Full offboards this month |
| D. Start MRR | Carry over last month’s end MRR |
| E. Churned MRR | Lost retainers |
| F. Contraction MRR | Downgrades from kept clients |
| G. Expansion MRR | Upsells from kept clients |
Then three formula columns do the work (adjust the cell letters to your sheet), plus one that turns churn into an annual dollar figure you will actually feel:
Logo churn %      = C / B
Gross rev churn % = E / D
Net rev retention = (D - E - F + G) / D
Annual $ lost     = (E + F) x 12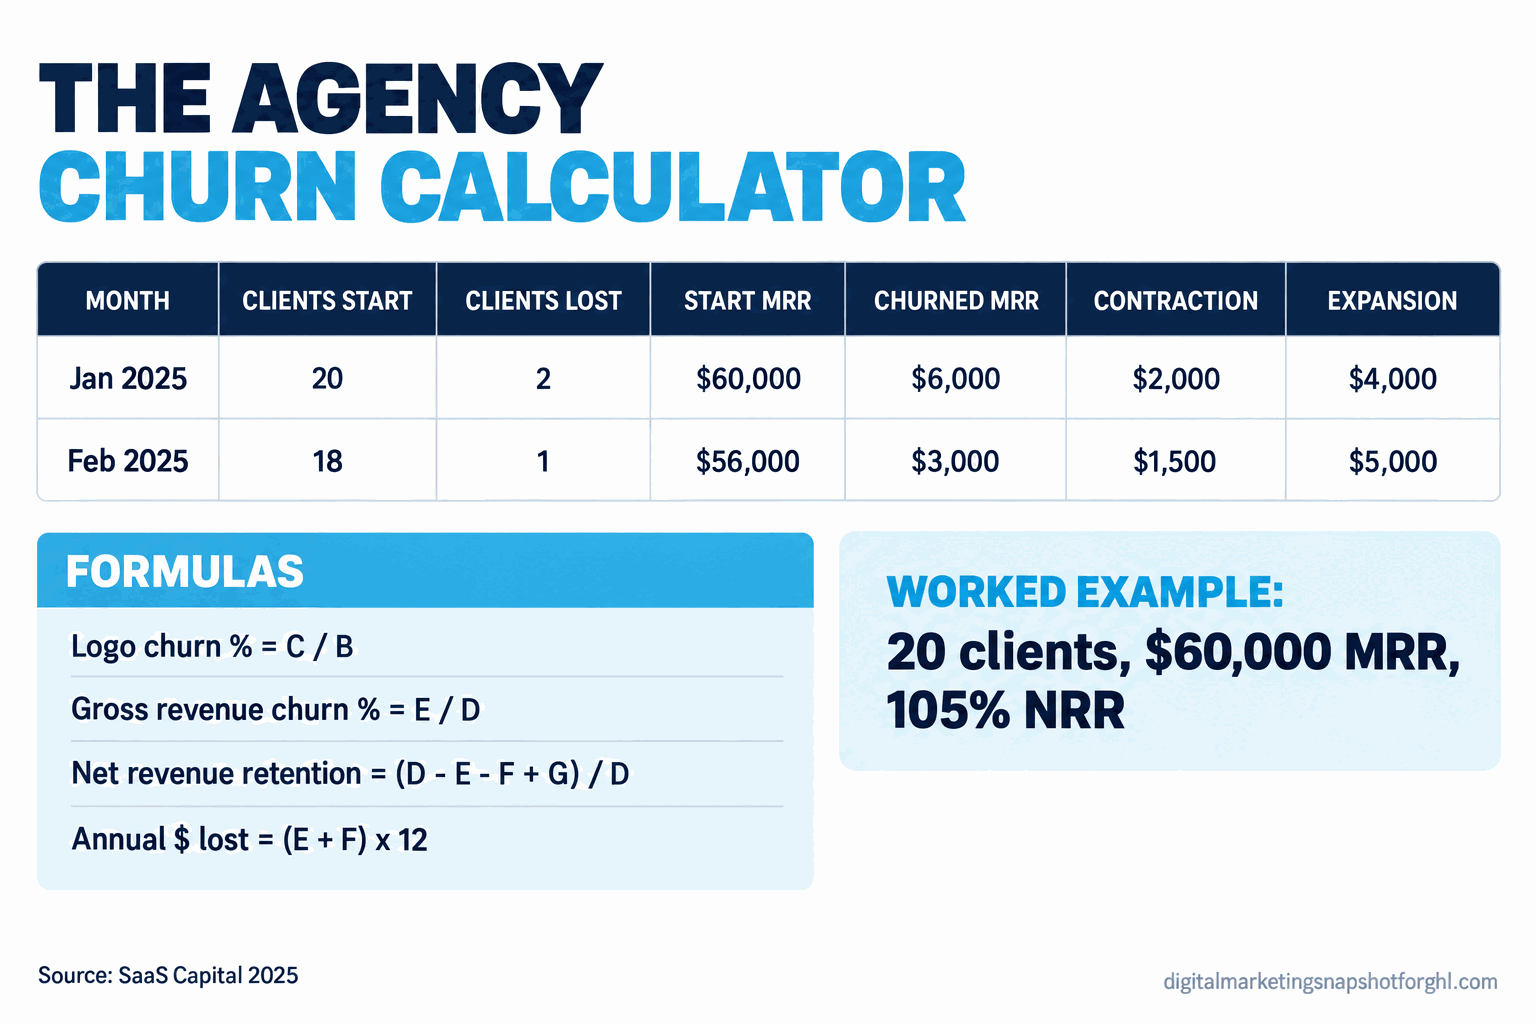
Save that as a template, fill it in on the first of every month, and you will know your three numbers before your coffee is cold. If you would rather the numbers populate themselves from the CRM than hand-key them, that is what a connected retainer-and-reporting system does, pre-built in the DM Snapshot.
Where your churn number lies to you
A churn number is only as honest as the way you count it, and these common mistakes make it look smaller than it is.
One blended number, no cohortsCount only full offboards as churnIgnore downgrades because the client stayedMeasure whenever someone remembersQuietly exclude clients you fired or paused
Blended number plus a quarterly cohort cutCount downgrades as contraction in NRRTreat every dollar of lost scope as churnSame close-of-month date, same definitions, every monthCount every departure, including the ones you ended
Counting only full offboards. The client who dropped from $6,000 to $2,000 did not churn by logo, but you lost two-thirds of that revenue. If it is not in your contraction column, your NRR is fiction. Downgrades are the most under-counted churn in agencies.
Blending away your onboarding problem. A flat 8% monthly churn might be two different businesses: one losing brand-new clients in month two, another losing veterans in month fourteen. The cohort check above tells them apart, and the fixes are opposite.
Counting your own fired clients as “fine.” The bad-fit client you offboarded on purpose is still churn in the math, and pretending otherwise hides an acquisition problem: you keep signing clients you later fire. Count them, then fix the top of the funnel, covered in how to get clients for a marketing agency. And hold your definitions still between months, or the trend is just noise.
The same calculator at three agency sizes
The formulas never change. What changes is how you run the ritual and which number you watch hardest.
Solo operator or freelancer (fewer than roughly 10 clients). One churned client swings your percentages wildly, so the headline number is noisy. Watch gross revenue churn in raw dollars, not percent, and protect your two or three biggest retainers like your rent depends on them, because it does. The biggest win here is proving value early, since a solo book lives and dies on the first 60 days.
Small agency, 1 to 10 people. Now percentages mean something, and nobody owns the number by default. Assign it, usually to whoever runs operations, and review all three metrics monthly. This is the band where NRR becomes your planning tool: above 100%, you can forecast growth from the existing book and ease off the new-business push. That is why retainers built to renew themselves move this number more than any discount will.
Growing agency, 11 to 20 and up. Here churn is a portfolio problem, and a blended number averages a healthy segment with a bleeding one. Cut churn by service line (is paid social churning while SEO holds?), by account manager, and by cohort. Set an NRR target, review it monthly against last year, and tie account-manager incentives to retention and expansion, not just delivery. This is also where cleaner lead attribution that proves ROI lifts NRR, because clients who see the return renew instead of leaving.
Objections agency owners actually raise
“We’re too small for this, we know our clients personally.” Knowing your clients is not knowing your numbers. The smaller you are, the more one quiet downgrade matters. Ten minutes a month is cheap insurance.
“Isn’t NRR a SaaS metric that doesn’t apply to agencies?” A retainer book is a subscription book. Recurring revenue, downgrades, upsells and cancellations are exactly the inputs NRR was built for. The label comes from software; the math fits a retainer agency.
“We’d rather spend the time winning new clients.” That instinct keeps the treadmill running. Since winning a client costs several times more than keeping one, an hour on churn usually beats an hour prospecting, and fixing the leak first makes every new client worth more.
Back to that first Monday and the new $3,000 client. With the calculator running, you would have seen the two offboards coming, caught the $6,000 account drifting toward a downgrade in its month-nine report, and had the renewal conversation while there was still a relationship to save. The new logo would have been growth on a stable book, not a patch over a leak. That is the difference between an agency that scales and one that runs to stand still, and it starts with three numbers you can calculate today.
FAQ
How do I calculate my agency's client churn rate?
Divide clients lost during a period by clients at the start, then multiply by 100. Begin the quarter with 20 clients and lose 2, and logo churn is (2 / 20) x 100 = 10%. For the full picture, also calculate gross revenue churn (MRR lost / starting MRR) and net revenue retention, which factors in upsells and downgrades.
What is a good churn rate for a marketing agency?
There is no reliable published 'agency average' worth trusting, so benchmark against your own trend. A practical target is net revenue retention above 100%: your book grows through upsells even with no new clients. Across private B2B subscription businesses the median NRR was about 101% in 2025, gross revenue retention near 90%.
What is the difference between logo churn and revenue churn?
Logo churn counts clients lost regardless of size, so a $500 and a $5,000 client look identical. Revenue churn weights the loss by money: MRR lost / starting MRR. Logo churn is an early-warning light; revenue churn is the actual damage. Track both, because low logo churn can hide a big revenue loss when a large client leaves.
What is net revenue retention and why does it matter for agencies?
NRR is the recurring revenue you keep from existing clients after churn, downgrades and upsells: (starting MRR minus churned MRR minus contraction plus expansion) / starting MRR. Above 100%, your book grows without new sales; below 100%, you sell to stay flat. It is the best single read on whether growth is durable.
How often should I measure agency churn?
Calculate logo churn, gross revenue churn and NRR monthly, on a fixed close-of-month date with definitions that never change. Each quarter, add a cohort check: take the clients who signed in one month and see how many remain. That shows whether you lose clients early (onboarding) or late (reporting).
Is the statistic that agencies lose a third of clients per year accurate?
It is not verifiable. The repeated figures of a one-third annual loss and a sub-five-year client lifespan do not trace to a credible source, so do not rely on them in planning or client conversations. Measure your own churn instead. Your real number, from your CRM or spreadsheet, is the only benchmark that should drive decisions.
Sources
SPI Research 2026 Professional Services Maturity Benchmark (509 firms) · Reichheld and Sasser, “Zero Defections,” Harvard Business Review (1990) · SaaS Capital 2025 B2B SaaS Retention Benchmarks · SaaS Capital: what is a good retention rate · Rocketlane: 2026 Professional Services Maturity Index · Ipsos: Shattering the Myths of Customer Loyalty